Using Wi-Fi to Detect Physical Movement
For this project, I used three ESP32 boards to detect movement through changes in Wi-Fi signals. Walking past them showed up in the measurements without using a camera or carrying a connected device. I also built an accompanying desktop program with Codex, called WaveLab, to watch the signals, run tests and record the results. What started as a small experiment ended up as a working Wi-Fi motion-sensing POC with its own software and a clear, successful outcome.
How it works
Wi-Fi transfers data using radio waves. The signals travel through the room and bounce off walls, furniture and people. Different copies of the signal reach the receiver along different paths and combine there. This is called multipath propagation.
When you move through the room, you change those paths. You might block part of the signal or change where it reflects. That changes what reaches the receiver. The University of Washington's WiSee research demo is worth a look: the team used movement-induced changes in wireless signals to recognise gestures.
I used ESP-NOW to send packets directly between ESP32 devices without connecting them to a router. It uses the Wi-Fi radio, but doesn't need to join a Wi-Fi network. The packets gave me a regular signal to measure as I moved around. You can read more about it in Espressif's ESP-NOW overview.
The measurements came from Channel State Information, or CSI. Instead of giving me a single signal-strength number, CSI provides more detail about how the radio channel affects different frequency components of a received packet. For this project, I looked at how much the measured signal amplitudes varied over time. Espressif's ESP-CSI overview explains the technology and links to videos showing it being used for sensing.
The setup
View full size
View full size
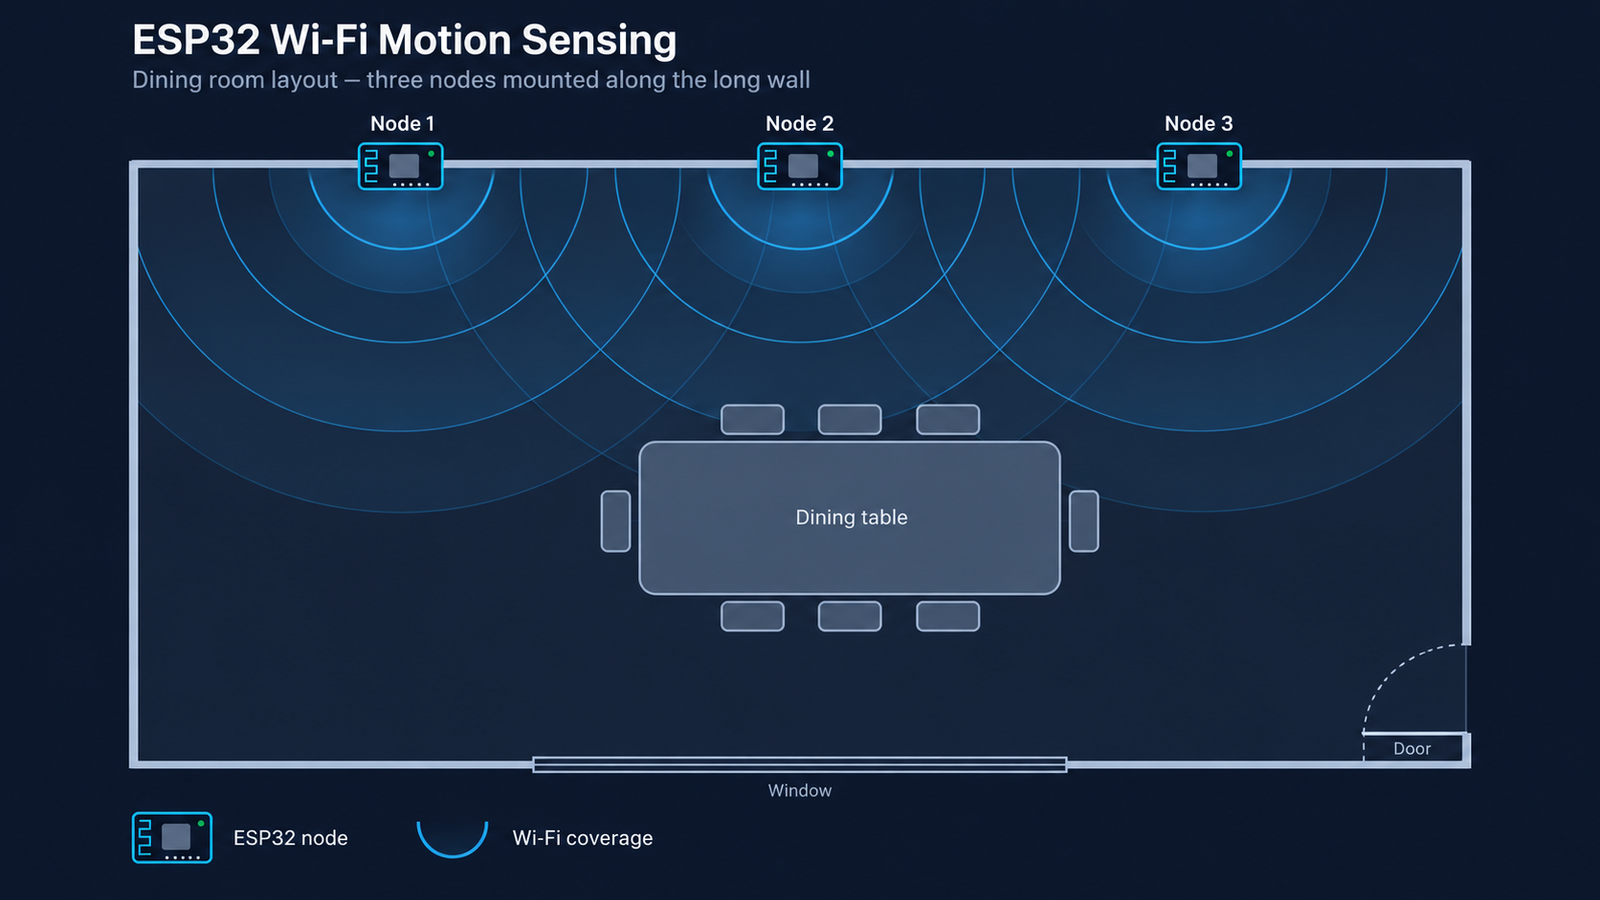
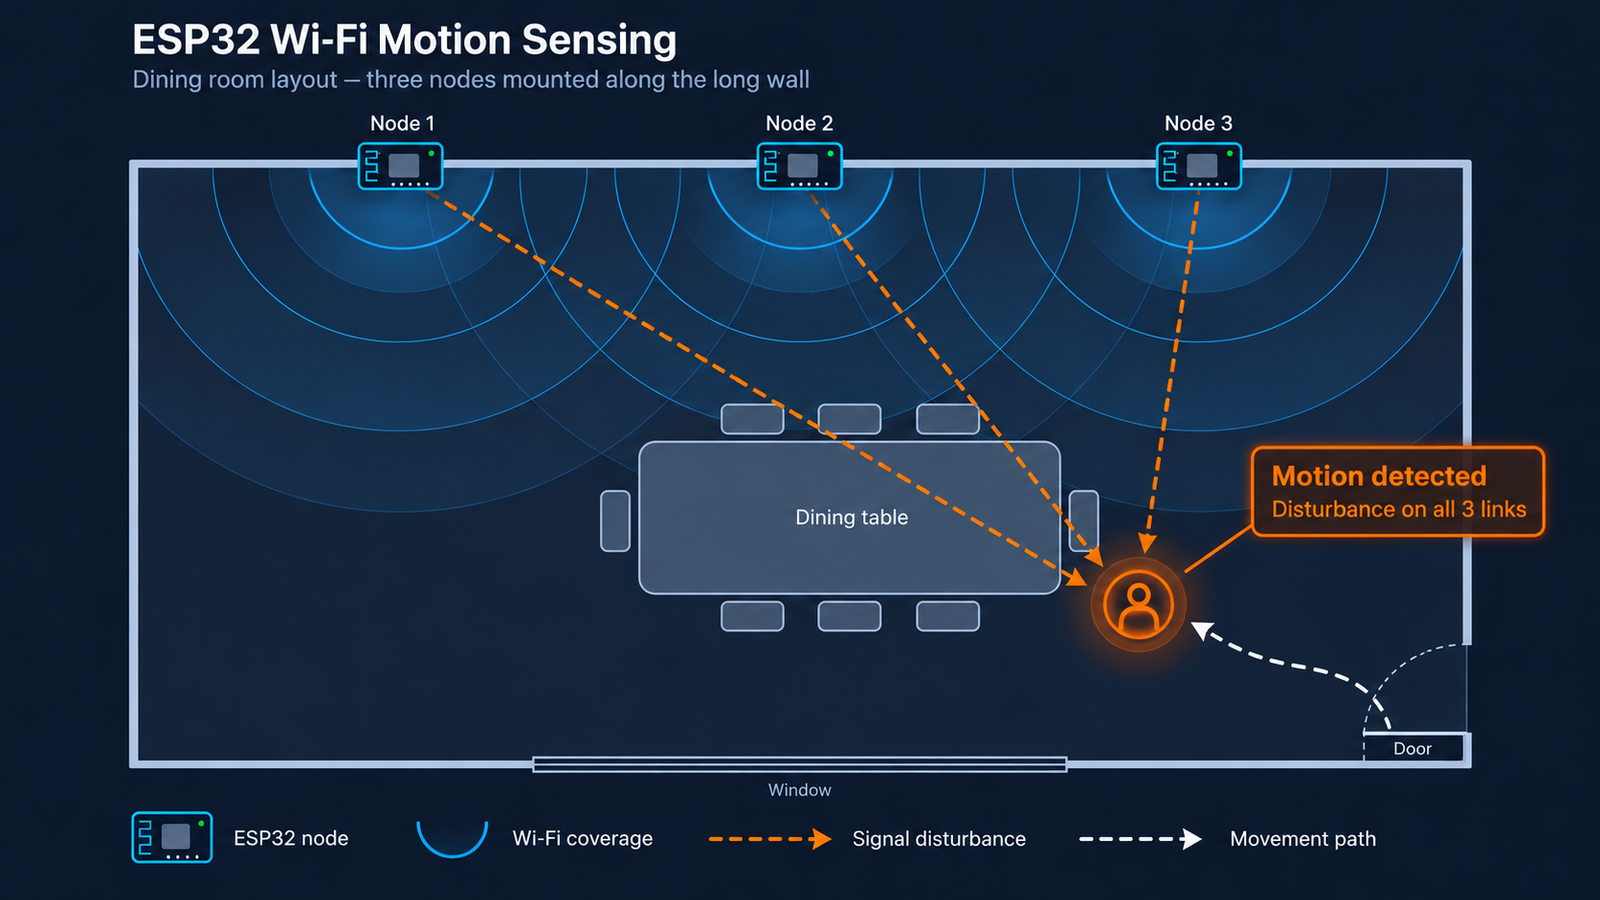
In the images above, you can see the idea behind the placement of the ESPs. For the initial testing, they were all close together on a desk. Once I'd proved the POC there, I moved them into the living room, about a metre apart, to see how it worked with more space.
The display ESP32 sent packets, and the ESP32-S3 fed the recorded CSI measurements to the laptop over USB. WaveLab handled the display, so the board's built-in screen wasn't needed.
I did hit a bottleneck getting the data onto the laptop. At 100 packets per second, the boards were producing text output almost as fast as the serial connection could carry it. Dropping to 50 packets per second reduced that load so the connection could keep up more comfortably.
Building WaveLab with Codex
WaveLab was built from scratch with Codex specifically for this project. I needed a way to turn the data coming from the ESPs into something I could watch while moving around the room. That grew into a desktop program with live graphs, recording, timed tests and playback of saved sessions.
It meant I could run a test, watch the signal change and then open the recording afterwards to look at what happened. Having my own program also meant I could add the controls and views I needed as the project developed.
View full size
View full size
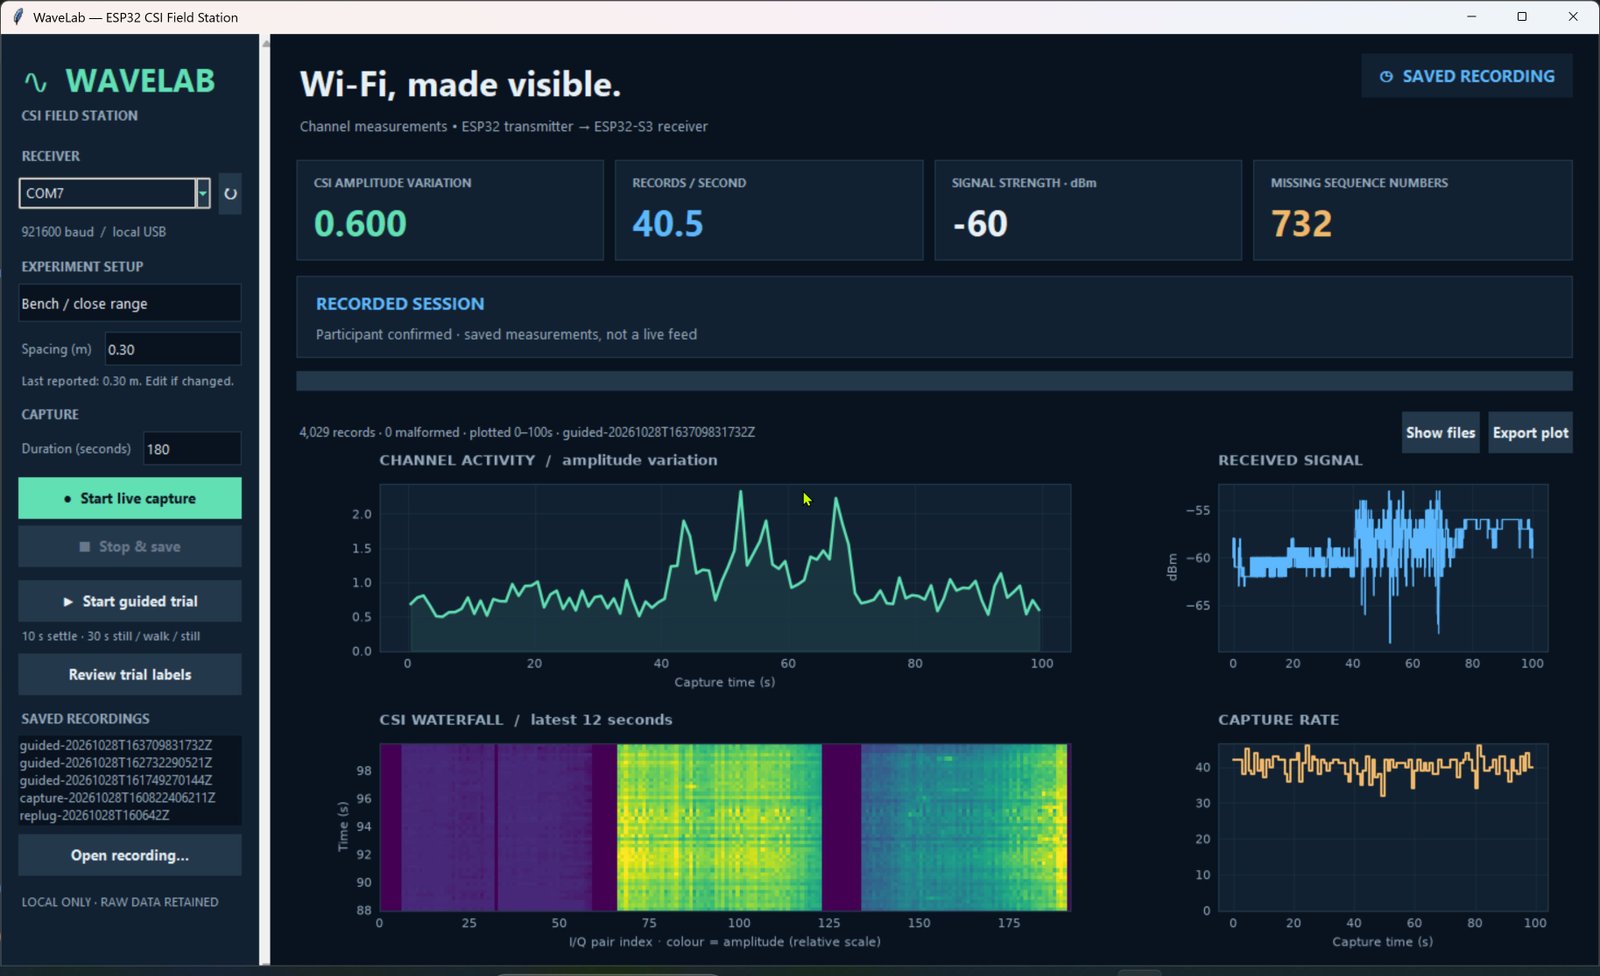
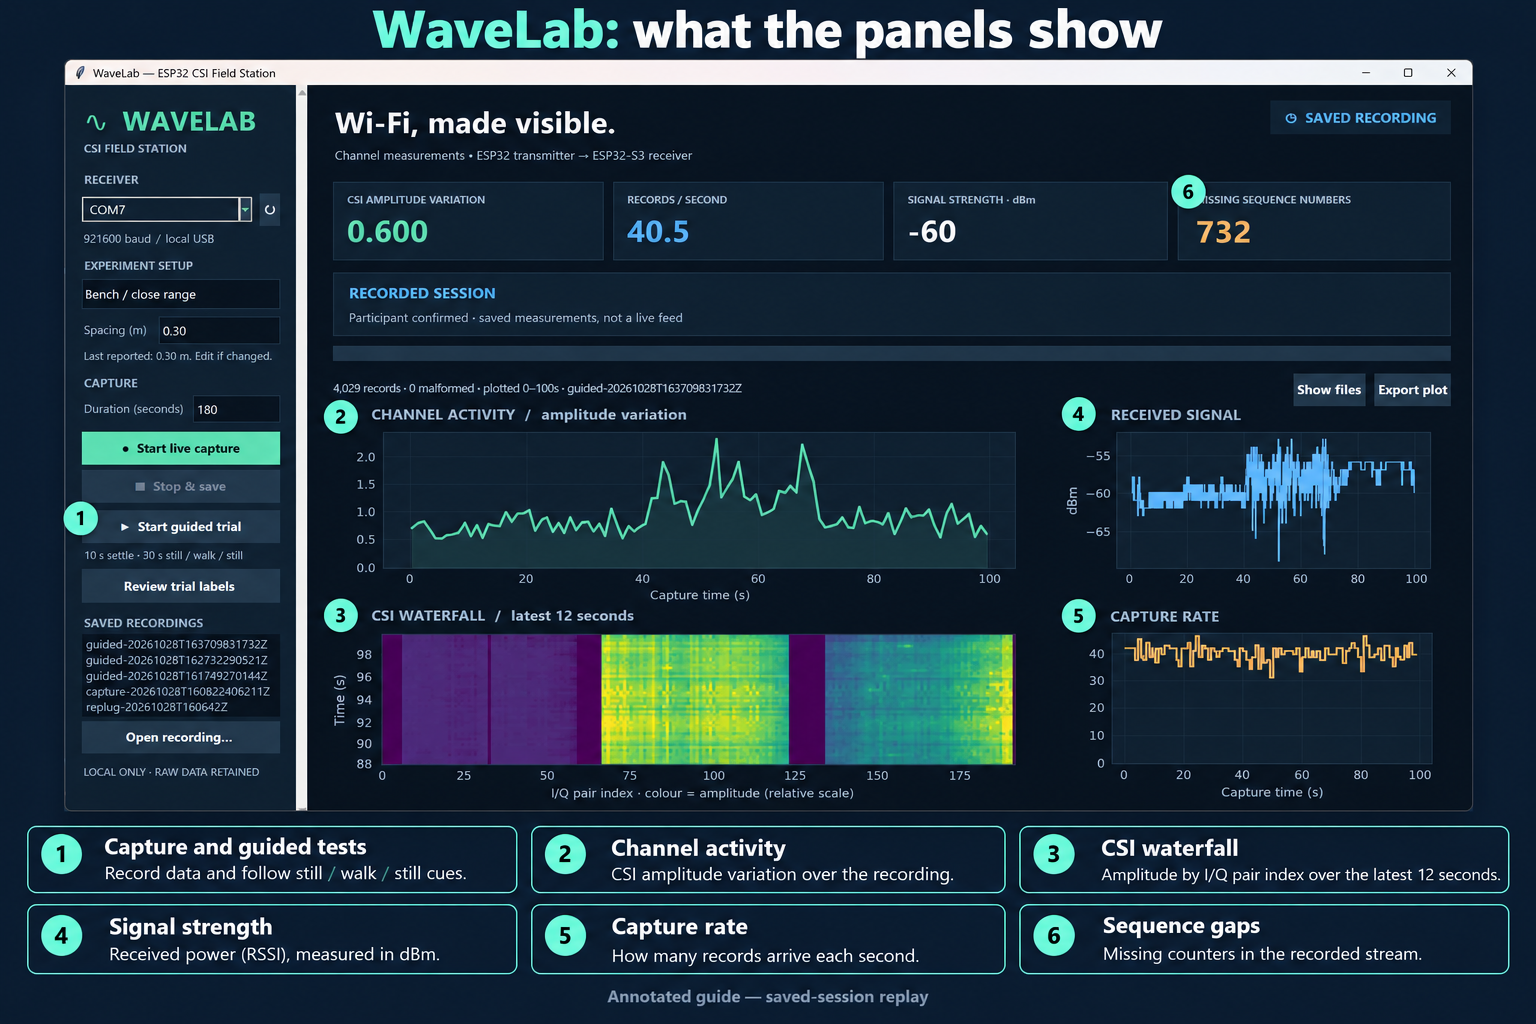
The green graph shows how much the CSI amplitude is changing. This is the main measurement I used to compare walking with standing still. The coloured waterfall shows amplitude across the recorded measurement indices over time, while the graphs on the right show signal strength and how quickly data is arriving.
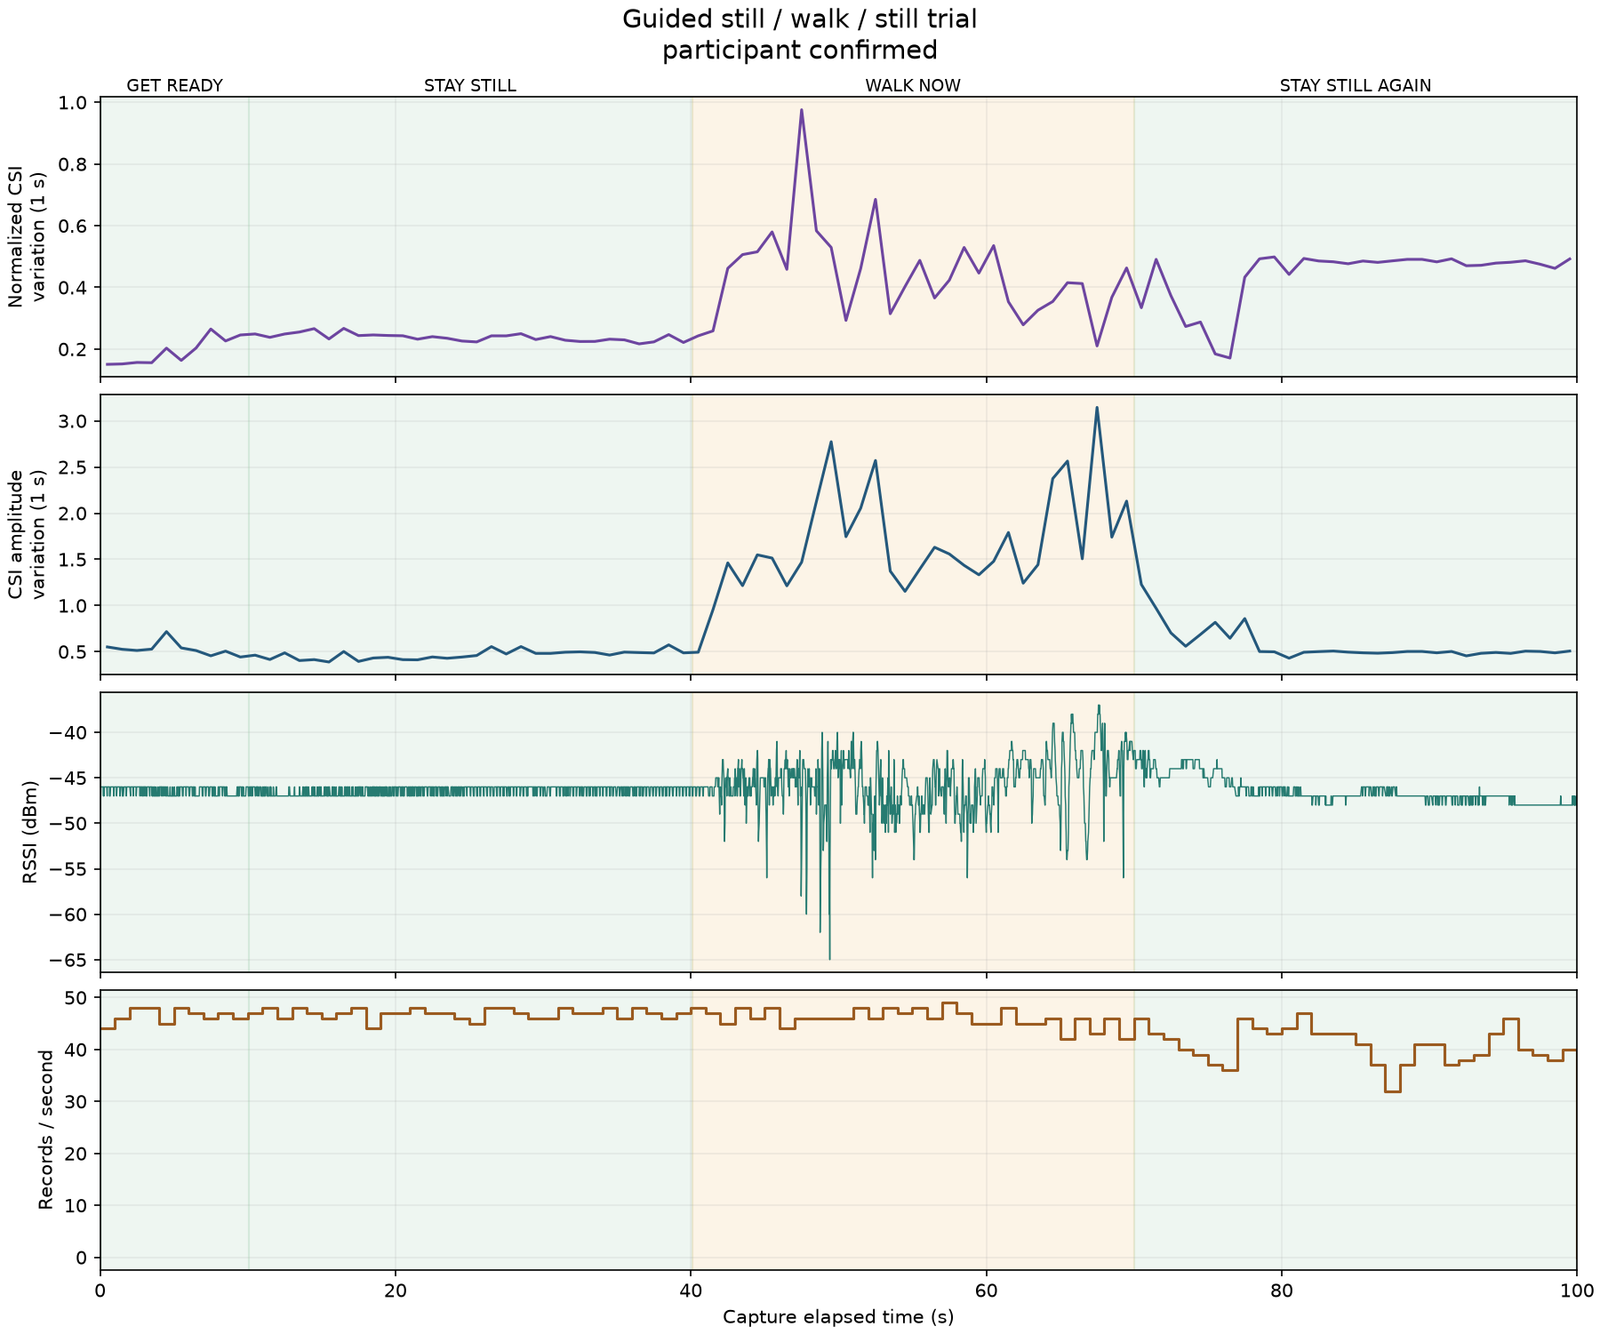
WaveLab gives timed instructions for the tests: stay still, walk, then stay still again. This made it easier to compare the signal with what I was doing.
Testing
The first confirmed desk test showed a clear increase in amplitude variation while I was walking: about 3.14 times the level across the still periods.
View full size
I then ran a few tests in the living room to get a clearer comparison between movement and standing still. Trying different routes and repeating the test helped me settle on a simple routine: stand still, walk around the room, then stand still again.
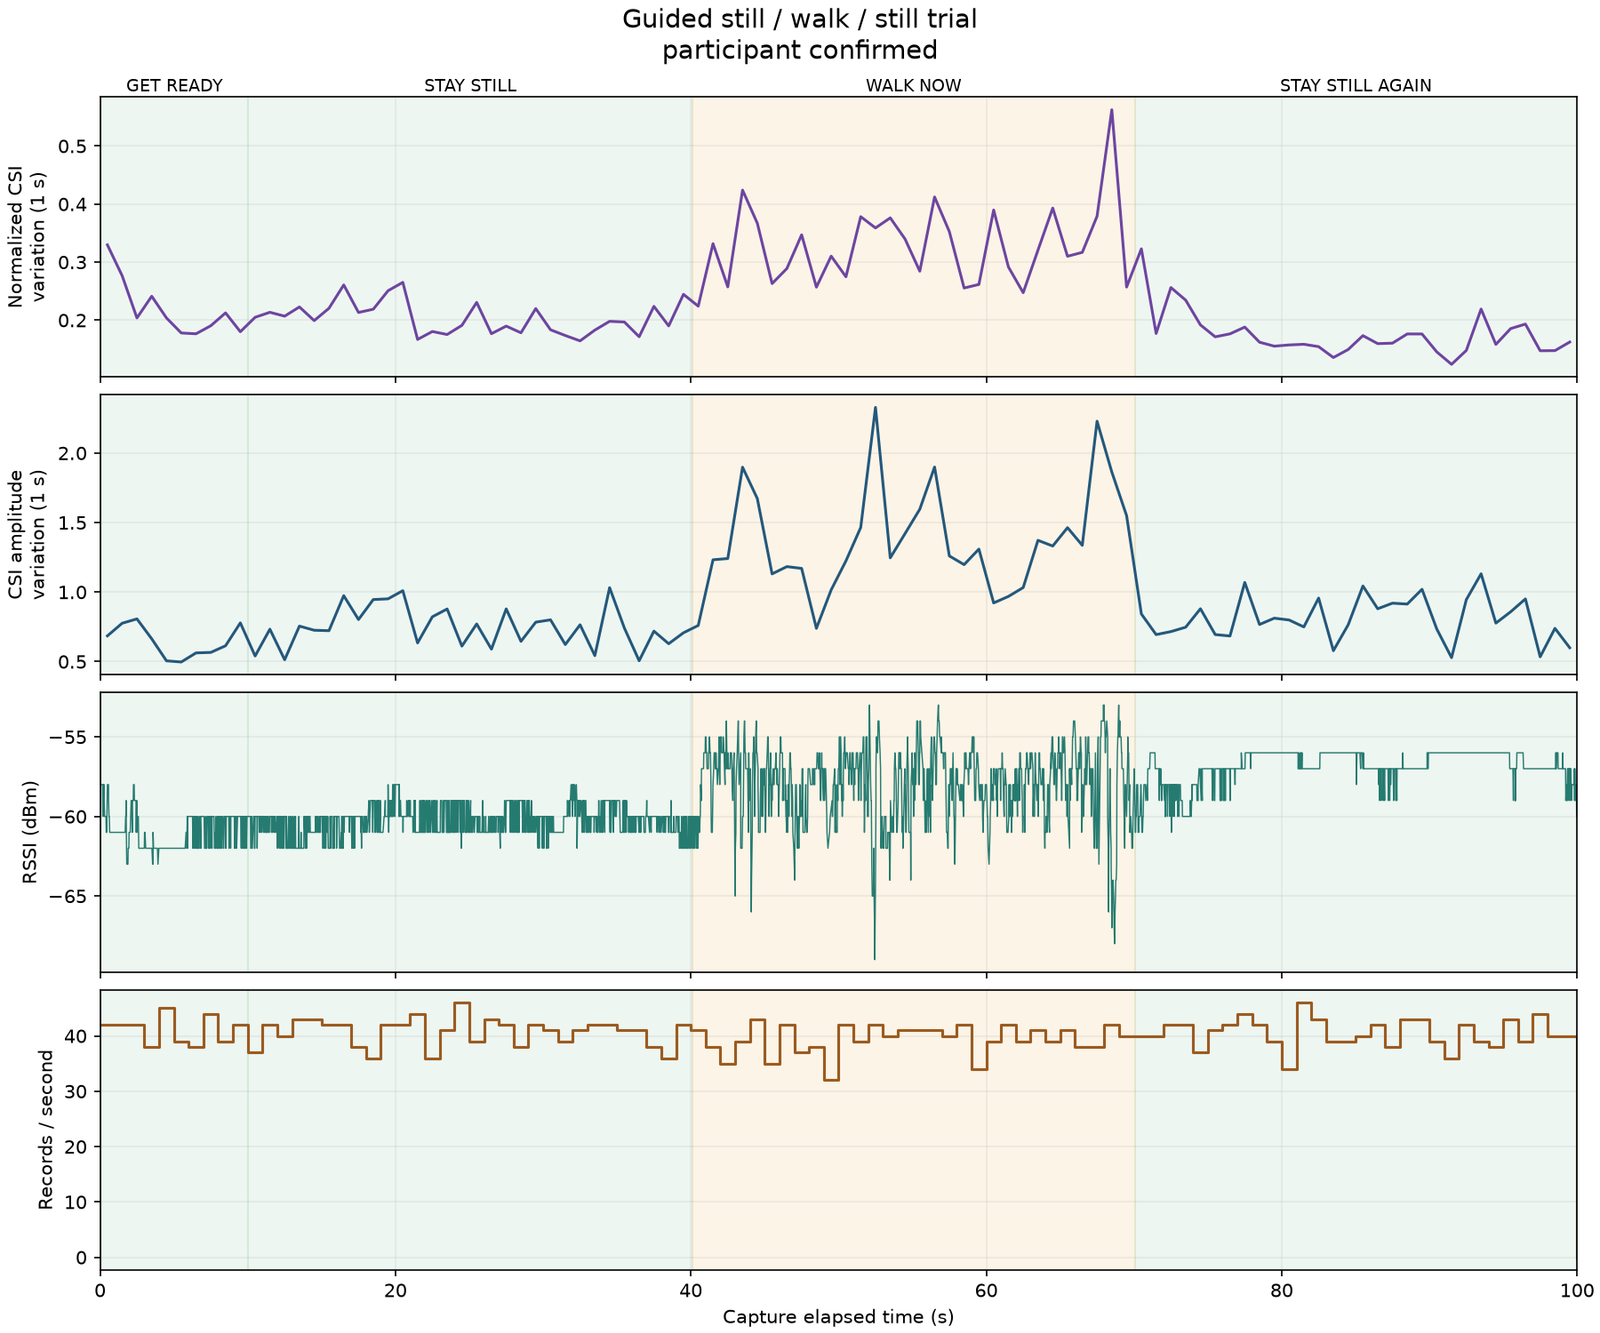
The recording was 100 seconds: 10 seconds to settle, 30 seconds still, 30 seconds walking and another 30 seconds still. WaveLab recorded 4,029 valid CSI measurements.
View full size
You can see the difference in the graphs, but I also wanted to put a number to it. I measured amplitude variation in one-second windows and used the median, or middle value, for each phase. That gives a better idea of the typical level than picking out the biggest spike. There were 25 complete windows per phase, with a short margin left around each change of activity.
| What I was doing | Median amplitude variation |
|---|---|
| Standing still before walking | 0.765 |
| Walking inside the room | 1.309 |
| Standing still afterwards | 0.812 |
During walking, the typical amplitude variation was 66% higher than the combined still-period baseline. After I stopped, it settled back to within 6.2% of its starting level. The baseline here is the median of the two still-phase values in the table.
The results show a clear increase while I was moving, followed by a drop when I stopped. That gave the POC a measurable result to back up what I could see in WaveLab.
Taking it further
I might look at taking this further later, potentially exploring room mapping or whether movement through a wall can be picked up. MIT's 2013 Wi-Vi demo is an interesting example of through-wall tracking using a purpose-built radio setup. For now, this was a mini side project I did when I was bored and wanted to see what my ESP32s could do. Seeing physical movement show up in Wi-Fi measurements was pretty interesting.
I'll make the WaveLab source code available for free.
Code link: